

KPI Check-In #3
Meet the new boss

Hello everyone.
Time for the Q3 Earnings report. This one will have the shareholders reeling. Here’s your standard primer below.
If you want to save yourself some time - this season has, so far, fallen below expectations, but in the interest of fan writing integrity, I’m going to see this through.
There’s also some quick notes on Stephen Robinson’s first game at the end.
To summarize the aim was to create a simple means of measurement across a few barometers purely related to data. The goal being to separate emotion and look at things objectively.
The targets were set for a third-placed finish based on historical data. You can also see the 10-game numbers below and the 20-game numbers. As it turns out, Game 20 was Thelin’s last as Aberdeen boss. So we have a pretty good barometer of the post-Jimmy period with these updated numbers.
This was a difficult stretch of games with six out of the ten against top 6 opponents but the form fell of a cliff to some degree and that’s why we’re in the predicament we’re in.
1. Points per game
Aberdeen 2024/25: 53pts (1.39pg)
Aberdeen 2025/26: Target 61.56pts (1.62pts per game)
10 game Actual: 1pt per game
20 game Actual: 1.25pts per game
30 game Actual: 1pt per game (-0.62pts per game behind target)
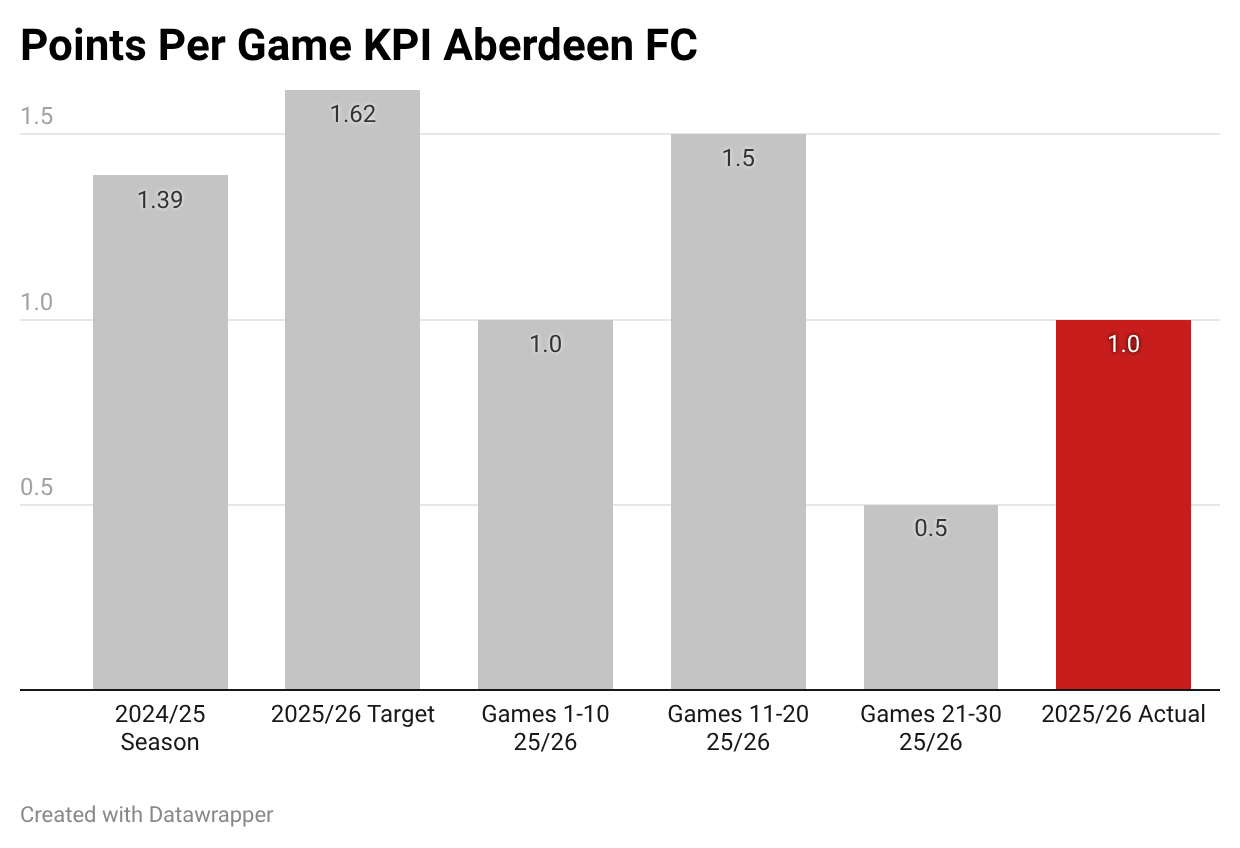
The milestones we were aiming for were:
After 10 games: 16.2pts (actual 10)
After 20 games: 32.4pts (actual 25)
The 30 game target was 48.6pts. Obviously that has not happened.
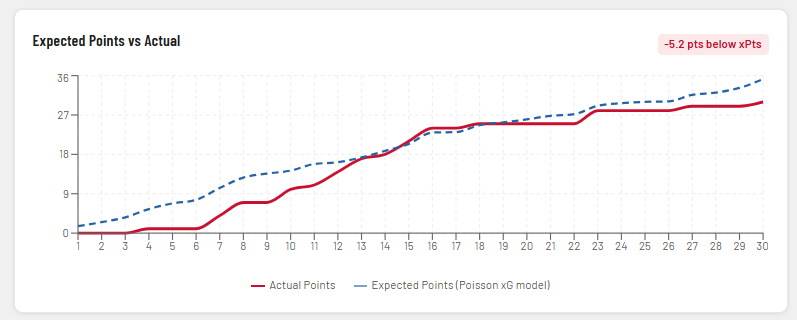
Expected Points
As is my want, I like to recreate last season’s expected points mapping.
Last year the nerd numbers were right. After 20 games we were
This year, after 20 games the Dons were meeting their expected points. Post-Thelin there’s been a departure suggesting some bad luck on the account of Leven, Docherty and even Robinson based on yesterday’s result. The Dons are currently 6pts worse off than they ‘should’ be. We’re just using FotMob data here but I expect other models are similar.
*I’ve noticed a flaw in this analysis as the xG points adjust as the season goes along, so I’m presenting my version below at 1.2xpts and also the per game version from stats.afc1903.com.
Aberdeen 2024/25: 1.21 xPts per game
Aberdeen 2025/26: Target 1.66 xPts per game
After 10 games: 1.4xPts per game
Games 11-20: 1.2xPts per game
20 game actual: 1.3xPts per game
30 game actual: 1.2xPts per game
This time last out, after 20 games we suggested based on the available evidence, that the Dons might be at 39pts after 30 games. The data currently suggest we should be at 36pts.
Side note - Robinson’s St. Mirren are showing on the FotMob table (at the time of writing) as -12pts than expected. It’s been quite a strange year for the old expected points table, Hibs currently sit in third above Hearts so make of that what you will.
Goals, Goals Conceded, Goal Difference
Aberdeen 2024/25: 48 GF, 61 GA, -13 GD
Aberdeen 2025/26: Target 0.32+ GD per game (+12 at end of season)
After 10 games: 7 GF, 11 GA, -4 GD
Games 11-20: 13 GF, 13 GA, 0 GD
20 game actual: 20GF, 24 GA, -4GD
30 game actual: 30GF, 42 GA, -12GD
xG, XGA, xGD
Aberdeen are underperforming their Expected Goals. The bad news: this is offset by an overperformance in Expected Goals Against.
Aberdeen 2024/25: -0.4xGD per game (-15xGD at end of season)
Aberdeen 2025/26: Target 0.32+ xGD per game (+12 at end of season)
Target: 0.32+ xGD per game (+12 at end of season)
After 10 games: +0.11xGD per game (projected +4.18GD at end of season)
After 20 games: -0.16xGD per game (projected -6GD at end of season)
After 30 games: -0.42xGD per game (projected -15GD at end of season_
Shots on Target
Aberdeen 2024/25: 3.8 shots on target per game
Aberdeen 2025/26: Target 4.2 shots on target per game
After 10 games: 3.6 shots on target per game
After 20 games: 3.9 shots on target per game
After 30 games: 3.6 shots on target per game
Clean Sheets
Aberdeen 2024/25: 8 clean sheets
Aberdeen 2025/26: Target 14 clean sheets
Actual: 7 clean sheets
Four clean sheets after ten games. Two from Games 11-20. One from Game 21-30.
Robbo
I don’t think there’s much more to be said on Robinson’s appointment that hasn’t already been covered. I agree with the general consensus, bad planning, seems reactionary but time to get behind the man. These all seem to be a bit of a toss-up anyway.
There’s a lot more data now on stats.afc1903.com. You can compare a lot of things but here’s his first game yesterday compared to the season averages:
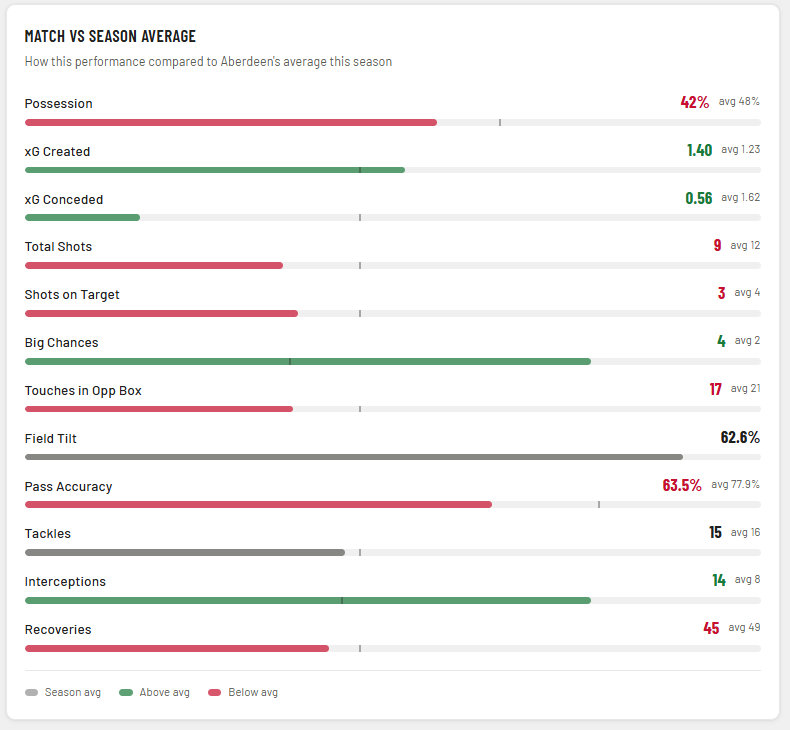
And this one is probably not a big surprise:
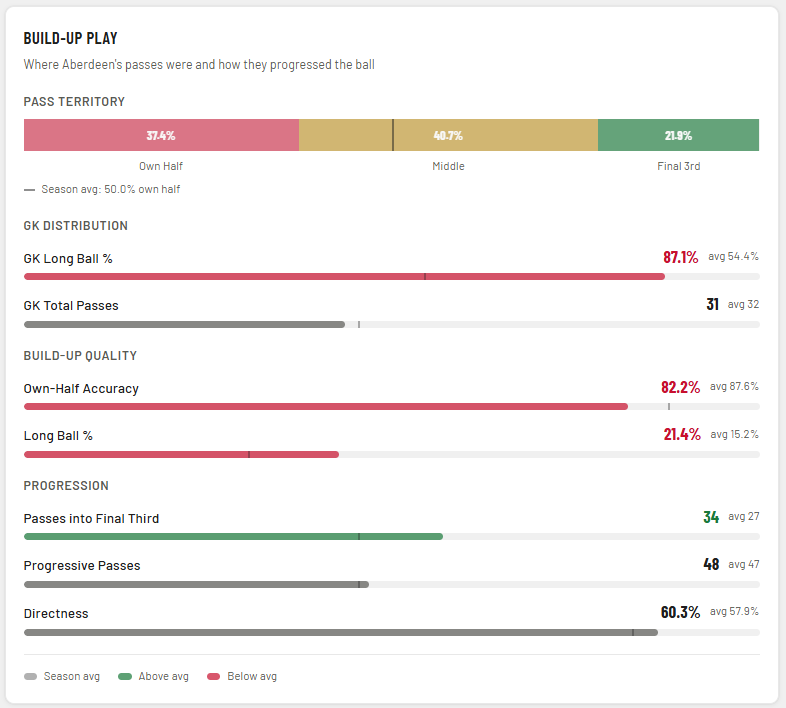
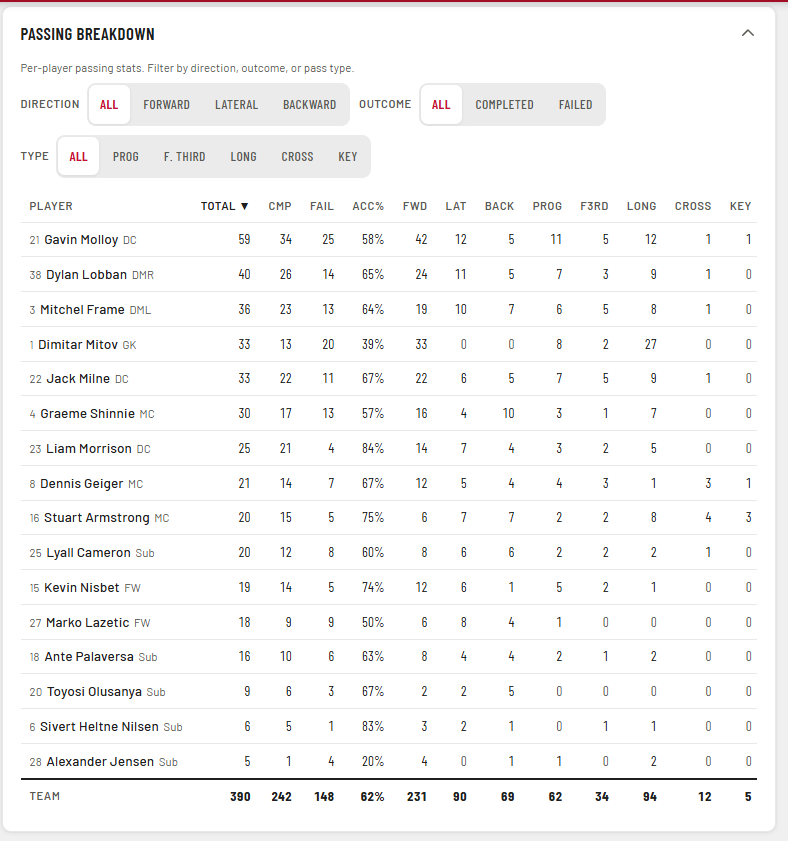
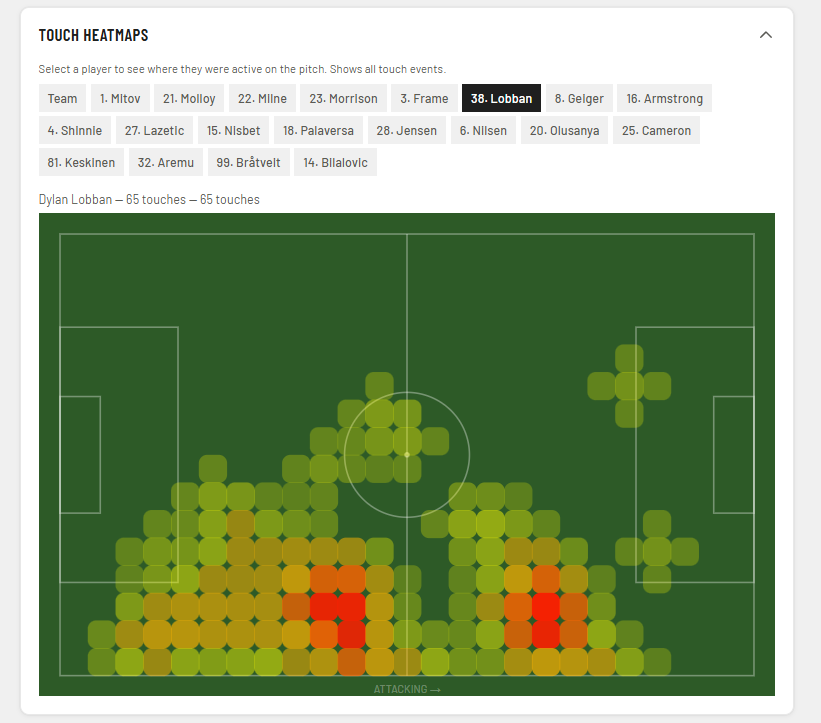
Additional features since last release (all data shown from Falkirk game)
Player Passing Breakdowns
Touch Heat Maps
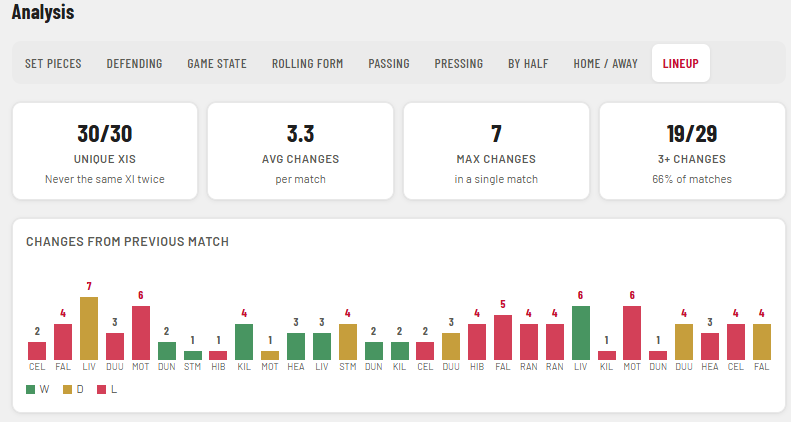
Lineup Analysis (request from reader Skirdy Loon)
If anything looks off, or if there’s anything you’d like to add please let me know. I’m going to try and previous season’s data in as well to offer some better comparisons.
Let’s get through this together. COYR.