

Setting the Benchmark
Let's get down to business

Hi everyone. I hope you’ve had a wonderful summer so far.
Unlike last season, when we eased ourselves back into the habit with four League Cup strolls, we’re waking up with a bang on Monday night in Gorgie. I’m certainly not ready, as this post will attest to, and it doesn’t feel like the team is, but we’ll soon find out. Yes, that Cup Final glow has faded quickly, unlike the new Hearts gaffer’s tan.
Back at it
The vast majority of output on afc1903.com has been poorly rehashed versions of other, more talented writers’ work. Season 2025/26 is unlikely to be any different. Accordingly, this is an idea pinched from Arsenal blog Cannon Stats.
At times last season, I think we were all wondering whether this team was any good. With the Scottish Cup win sitting in the boardroom, the answer to the question may not even matter, but I found myself digging into different data sources to try and figure it out. This exercise will provide some ongoing benchmarks to assist us in seeing how the team is progressing.
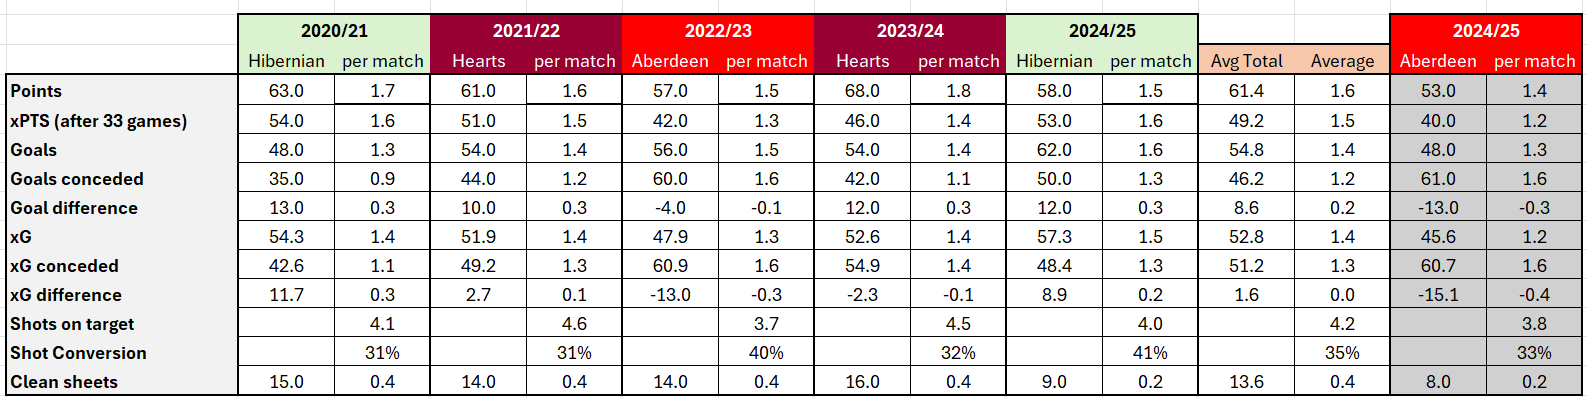
I took a look at the third-place finishers over the last five seasons across a few different metrics. There’s quite a wide range between the five teams that finished in that position. Luck will play its part, but our hope is that the Dons do their best to keep that to a minimum.
There are more advanced stats, but I only have access to what FotMob can provide over this historical stretch. Apologies if you’re reading this on your phone, as it’s probably too small to read. I’ll elaborate on each one further down.
Points
Average: 61.4
Per Game: 1.62
Points are the most critical of these ‘metrics’ but are largely a result of the others. Last season was the second-lowest total of the last five years, so clearly a missed opportunity given the start to the campaign.
Most of the opportunity probably comes on the road. Aberdeen haven’t managed more than five away wins in a season since 2020/21.
Target: 1.62pts per game
This gets us to the following totals at each quarter:
After 10 games: 16.2pts
After 20 games: 32.4pts
After 30 games: 48.6pts
After 38 games: 61.56pts
Aberdeen 2024/25: 53pts (1.39pg)
Gap to Target total: 9pts (0.22pg)
Expected Points
The challenge with per-game points totals is that it is harder to use this as a predictor for future performance. Last season, for example, we would have been on 2.8ppg at the ten-game check-in, and as we know, that pace was unsustainable. Expected Points might be a better predictor?
I looked at this in December and, though it seemed surprising at the time, the models were pretty close in the end (they all predicted a 50-point season).
Unfortunately, I couldn’t get the full 38-game xPTs from FotMob, so we’re working off of 33-game totals, which should still give us a pretty good guide. Again, there are some large variations. In my opinion, given the nature of the top 6, working from a 60pt target, you’d want to be hitting 56pts, which gets you at 1.66 xPts per game but that’s higher than anyone else has achieved in the last five seasons.
Target: 1.66 xPts per game
Aberdeen 2024/25: 40 xPts (1.21 xPts per game)
Gap to Target: 16pts, 0.45 xPts per game
Goals, Goals Conceded, Goal Difference
You’ll be spotting a theme here regarding the 2022/23 season. Aside from ‘Robson’s Rescue’, the average Goal Difference is about 12 goals. Last year, the Dons were at -13, and we still managed 53 points. You could argue the top six defeats to Rangers and Celtic skewed those numbers, but Aberdeen need to score more goals and concede fewer this season. Nothing you didn’t know already. 23 of those 48 goals have since departed the squad. Slightly less than I thought but a significant contribution. Yengi and Milanovic to pick up the slack and add the extra?
Target: 0.32+ GD per game (+12 at end of season)
Aberdeen 2024/25: 48 GF, 61 GA, -13 GD
Gap to target: 25 Goals !! (+0.66 GD per game)
xG, XGA, xGD
Lumping all three of these together, just like the above. Last season should have convinced all of us that these metrics have merit, yet looking at this data, again, we have large variations, and we have teams, namely the Dons in 2022/23 and Hearts in 2023/24, performing well below the other sides.
Despite the -13GD, Aberdeen over-performed their xGD by two goals last year. The aim should be the same as the regular GD. So we’ll shoot for +12 here as well. Might be a stretch.
Target: 0.32+ xGD per game (+12 at end of season)
Aberdeen 2024/25: -0.4xGD per game (-15xGD at end of season)
Gap to target: 27xGD, 0.72 xGD
Shots on Target/Shot Conversion
I wrote a few articles on this during last season, this probably being the most in-depth one. Using data from Alan Morrison of the Huddle Breakdown, historical shot conversion for on-target shots is around 32%, which is where the Dons were this year. This does seem to be one metric in which Hibs overperformed last year.
But Aberdeen were lower in terms of shots on target per game - 3.8 versus an average of 4.2. That’s 15 extra shots on target a season and possibly five goals.
Aberdeen’s 24/25 season was one of incredibly high conversion rates, followed by very low, followed by a regression to the mean. So more shots on goal, and more consistency in converting chances.
Target: 4.2 shots on target per game
Aberdeen 2024/25: 3.8 shots on target per game
Gap to target: 0.4 shots on target per game (15.2 over the course of the season).
Topi Keskinen was Aberdeen’s joint top shooter last season, with 56 shots (. Milanovic will help increase contributions from wide areas, as he’s more Mo Salah than Shayden Morris. The other player who got 56 shots off was Kevin Nisbet. Aberdeen’s attacking intentions are a topic for another day, probably September 1st.
Interestingly, the Dons were third in the league last season for touches in the opposition box, which would seem to suggest the team is doing a solid job getting the ball into the opponents’ penalty area but not creating good enough chances when they do so. Maybe the strikers were taking too many touches.
Clean Sheets
Dimitar Mitov staying fit for the whole season is going to be important. As a reminder, the Bulgarian only played 23.5 games in the league last year, just over 60%. Hibs bucked the trend, this season, only managing nine clean sheets, versus around 14 for the other third-place finishers.
However, I think it’s still fair to have some reservations about Aberdeen’s defensive strength in open play and on set-pieces.
Target: 14 clean sheets
Aberdeen 2024/25: 8 clean sheets
Gap to target: 6 clean sheets
Summary
Consistency is clearly an area in which we need to see improvement, and I think that’s the main goal of taking a look at some of this data. There are a couple of different ways this could go.
It’s August 2nd right now. Still a month left of the window, and by the time we check back in on this topic, we’ll be in November. Things will be different then.
Plans Ahead
Most of my articles start with a simple question, and then I try and dig into game footage and data to come up with some kind of answer. What I realised last season was that keeping better records would make the research process a lot quicker.
So I might be a little slower and possibly less frequent with posts, at least until we get up and running, and take a bit more time to gather data post-game. Europe will be a whole other kettle of fish, too. Though I doubt it’s the request or expectation, I won’t be able to cover everything. I’ll probably be back before the Celtic game with some thoughts on the season opener.
2025/26 is going to be another fun ride. Strap yourselves in.
COYR