And. We're Back.
Check yourself before you wreck yourself
Hello everyone.
Apologies for the long hiatus between posts. I’ve recently taken a part-time job with a youth club over here and my time has been limited. There’s certainly been no shortage of topics to discuss. Unfortunately I have not been able to spend the hours rewatching and analyzing the games.
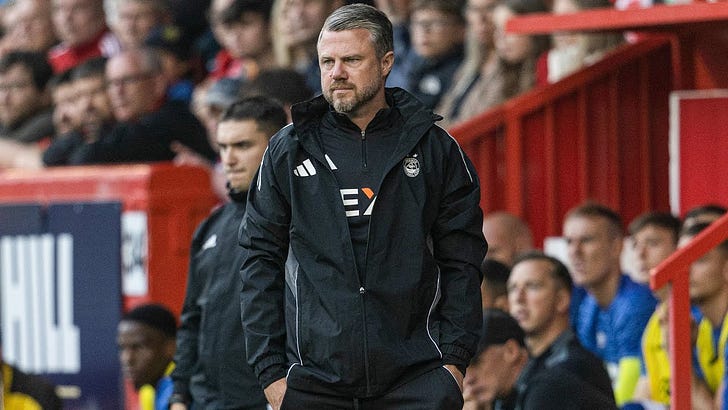
Tomorrow the Dons play Motherwell looking for their fourth league win in five (amazing how narratives can be developed). A second away win at a classic SPFL dogmatic outfit in a row was followed by a resilient performance away to a a decent Larnaca side. Maybe Jimmy is learning some lessons after all. Two youth academy products, started, four Aberdeonians took to the field.
Anyway we’re 10 games in. Sadly we missed out on Russell Martin’s the Rangers but we it’s a big enough sample to check in on the KPIs from the start of the season. Here’s the original post below.
The targets were set for a third-placed finish based on historical data. Hearts performances this season may be offset by a poor Rangers but it is still possible that hitting these numbers would not get the Dons in the top three. However, we cannot control what others do.
1. Points per game
Aberdeen 2024/25: 53pts (1.39pg)
Aberdeen 2025/26: Target 61.56pts (1.62pts per game)
Target: 1.62pts per game (61.56 for the season)
Actual: 1pt per game (-6.2)
This gets us to the following totals at each quarter:
After 10 games: 16.2pts
Actual: 10pts (6.2pts behind target)
So we’re two wins behind target. In order for us to get to the next milestone (32.4pts after 20 games), we will need the Dons to pick up 21pts from 30.
Expected Points
There’s certainly some scepticism related to ‘expected data’ but we all saw how last season turned out:
I looked at this in December and, though it seemed surprising at the time, the models were pretty close in the end (they all predicted a 50-point season).
We’re just using FotMob data here but I expect other models are similar.
Aberdeen 2024/25: 1.21 xPts per game
Aberdeen 2025/26: 1.4xPts per game
Target: 1.66 xPts per game
I think this has been noted in other circles and gets to the crux of the argument here. Aberdeen are not as bad as things seem but not as good as we want them to be. So if the Dons were to ‘regress to the mean’ and catch up, we’d be looking at a final points total of 53pts.. If they have to swallow up the bad start and pacing 1.4pts from now on, we’re looking at 49pts.
Goals, Goals Conceded, Goal Difference
Aberdeen 2024/25: 48 GF, 61 GA, -13 GD
Aberdeen 2025/26: 7 GF, 11 GA, -4 GD
Target: 0.32+ GD per game (+12 at end of season)
Actual: -0.4GD
Reminder we scored four goals in one game. Yeah this is not good fellas. Any hope below?
xG, XGA, xGD
Aberdeen 2024/25: -0.4xGD per game (-15xGD at end of season)
Aberdeen 2025/26: +0.11xGD per game (projected +4.18GD at end of season)
Target: 0.32+ xGD per game (+12 at end of season)
The issue here is scoring goals. Goals conceded matches up fairly close with actuals but FotMob has us six goals better off than we actually are.
Shots on Target/Shot Conversion
I wrote a few articles on this during last season, this probably being the most in-depth one. Using data from Alan Morrison of the Huddle Breakdown, historical shot conversion for on-target shots is around 32%, which is where the Dons were this year. This does seem to be one metric in which Hibs overperformed last year.
But Aberdeen were lower in terms of shots on target per game - 3.8 versus an average of 4.2. That’s 15 extra shots on target a season and possibly five goals.
Aberdeen’s 24/25 season was one of incredibly high conversion rates, followed by very low, followed by a regression to the mean. So more shots on goal, and more consistency in converting chances.
Aberdeen 2024/25: 3.8 shots on target per game
Aberdeen 2025/26: 3.6 shots on target per game
Target: 4.2 shots on target per game
So we’re performing worse than last year on this metric and quite a bit away from our target. This would warrant a bigger post.
Clean Sheets
Aberdeen 2024/25: 8 clean sheets
Aberdeen 2025/26: 4 clean sheets
Target: 14 clean sheets
Actually this looks more promising and can probably be directly attributed to the switch to the back three/five.
Summary
Based on the numbers I think we can maybe predict somewhere in the region of 25 points by the time the Dons head to Ibrox on January 6th.
There’s more to be written here of course. The tactics of the new system and its sustainability as other teams adapt. Can we address the lack of goals. Do we have money to bring in new players in January and if we do, do we trust the club to get the right ones. And on the numbers we really would want to dig into them more. This is pretty surface level.
Things will either get better, get worse or stay the same before our next check-in on these numbers in early 2026. If they get worse Jimmy will be on his way back to Sweden. If they stay the same, we’ll be sitting on 20pts. Top six will likely be gone and relegation not off the menu.


Love this detailed breakdown, it reminds me of training AI models. How do you factor in external influences like player injuries?