

KPI Check-In
Bang Average

Hello everyone.
Another defeat for the Dons yesterday. For those of you shoveling snow at least you can get back to that more enjoyable activity now you don’t have to watch Aberdeen. Or maybe you’re just doomscrolling. Or even trying to identify which Egos are the Enemy.
This is not a review of the Falkirk game, instead, now the Dons have played 20 games, it’s time to do the second check-in on the KPIs set at the start of the season. For a refresher, please see the original post below.
To summarize the aim was to create a simple means of measurement across a few barometers purely related to data. The goal being to separate emotion and look at things objectively.
The targets were set for a third-placed finish based on historical data. You can also see the 10-game numbers below. Its doubtful 62pts will be good enough for third this year but we can only control what we can control.
1. Points per game
Aberdeen 2024/25: 53pts (1.39pg)
Aberdeen 2025/26: Target 61.56pts (1.62pts per game)
10 game Actual: 1pt per game (-6.2)
20 game Actual: 1.25pts per game
Worth noting our last 10 games have been 1.5pts (15 total) so we have been getting closer to the target.
The milestones we were aiming for were:
After 10 games: 16.2pts (actual 10)
After 20 games: 32.4pts (actual 25)
The 30 game target is 48.6pts. We will need 23pts from 30 to get to that number.
Expected Points
As is my want, I like to recreate last season’s expected points mapping.
Last year the nerd numbers were right. This year, it’s taken 20 games and we’re pretty much there again. The silver lining this year was that we were better than our points suggested, but that’s because our actual points were so bad. In order to prove the point somewhat, and I did not expect this to be perfect, here’s what I said in the 10-game check-in (broken clocks, blind squirrels etc.)

Here’s the expected points mapped out then for 25/26.
We’re just using FotMob data here but I expect other models are similar.
Aberdeen 2024/25: 1.21 xPts per game
Aberdeen 2025/26: Target 1.66 xPts per game
After 10 games: 1.4xPts per game
Games 11-20: 1.2xPts per game
20 game actual: 1.3xPts per game
Based on the available evidence, we can suggest the Dons might be at 39pts after 30 games. Extrapolate that out to the split mark (33 games) and we’re at 43pts. Possibly enough for split, but will be tight. We’ve over-performed last ten matches.
Goals, Goals Conceded, Goal Difference
Aberdeen 2024/25: 48 GF, 61 GA, -13 GD
Aberdeen 2025/26: Target 0.32+ GD per game (+12 at end of season)
After 10 games: 7 GF, 11 GA, -4 GD
Games 11-20: 13 GF, 13 GA, 0 GD
20 game actual: 20GF, 24 GA, -4GD
There’s a clear split between the top 5 and the remainder of the league in terms of GD. Goals win games. This is not great. Maybe we’re just missing chances?
xG, XGA, xGD
The good news: Aberdeen are underperforming their Expected Goals. The bad news: this is offset by an overperformance in Expected Goals Against.
Aberdeen 2024/25: -0.4xGD per game (-15xGD at end of season)
Aberdeen 2025/26: Target 0.32+ xGD per game (+12 at end of season)
Target: 0.32+ xGD per game (+12 at end of season)
After 10 games: +0.11xGD per game (projected +4.18GD at end of season)
After 20 games: -0.16xGD per game (projected -6GD at end of season)
Things are getting worse on this front.
Shots on Target
Aberdeen 2024/25: 3.8 shots on target per game
Aberdeen 2025/26: Target 4.2 shots on target per game
After 10 games: 3.6 shots on target per game
After 20 games: 3.9 shots on target per game
So actually a bit of an uptick here over the last ten matches. I was intrigued by this, so here’s the breakdown.
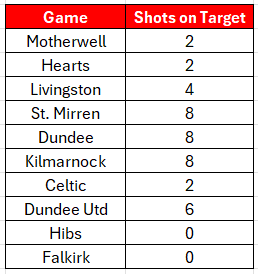
It did seem like the attacking intent/success was being layered upon the defensive solidity right around that St. Mirren/Dundee/Kilmarnock but it’s since walked over towards a steep verge and in the last two games fallen off that cliff. Tricky to put a positive spin on zero shots on target.
For more background on this I wrote some articles last season this probably being the most in-depth piece i did last year. Aberdeen’s current shot conversion is 7.9% (total shots/goals) which is pretty low. Averages are typically around 11%.
Clean Sheets
Aberdeen 2024/25: 8 clean sheets
Aberdeen 2025/26: Target 14 clean sheets
Actual: 6 clean sheets
Doing better here but we had four clean sheets after ten games. We’ve only managed two in the last ten.
Summary
We’re now past the mid-point of the season. Though the league table can be prone to lying and it might be telling a wee fib in regards to Aberdeen’s 8th place, it’s just a wee one. As the numbers suggest, Aberdeen right now are borderline top 6 outfit, just as they were last season.
Things could improve but I’d advise caution. Of the next ten games, perhaps potential wins over Kilmarnock (A), Livingston (H) and Dundee (H). As things stand, I can’t see much optimism for the others. Take a look yourselves.

There’s plenty more discourse on the manager’s future online and no doubt everyone has their own opinion. But things just aren’t much fun at the moment.
At some point, in the future I’ll really try and drill down into the myths of Jimmy’s glorious 11 game run at the start of last season but I will offer this article written after the Nisbet winner vs Ross County.

I’ve never really felt Thelin’s Aberdeen were a high-pressing outfit but at the point they did rank 2nd (behind Rangers) in ‘Possession won final 3rd per match’ with a score of 4.5 regains per match. Only four games in mind you.
Right now, we are 12 of 12 in the same metric. 2.3 regains per match.
Fun week ahead. COYR.
Great stuff again Gav. Personally, I side more with Ebbe Skovdahl on the data/statistics... but it's hard to argue when it proves exactly what we are; mid table mediocrity. Here's hoping for an upturn in these statistics by at least the split.
Good read again. So it's looking like the stats don't lie and neither do our eyes, we are firmly a mid table team and have been for some time. With all that I do wonder what makes Cormack et al think Thelin is still the right man?